Traffic is down fifteen per cent, rankings look the same, and nobody changed anything. Before you accept a diagnosis of AI Overviews traffic loss — which is the fashionable answer to every decline right now — it is worth establishing whether that is actually what happened. The evidence is in Search Console, it takes about twenty minutes, and half the time the answer turns out to be something else entirely.
The signature of AI Overviews traffic loss
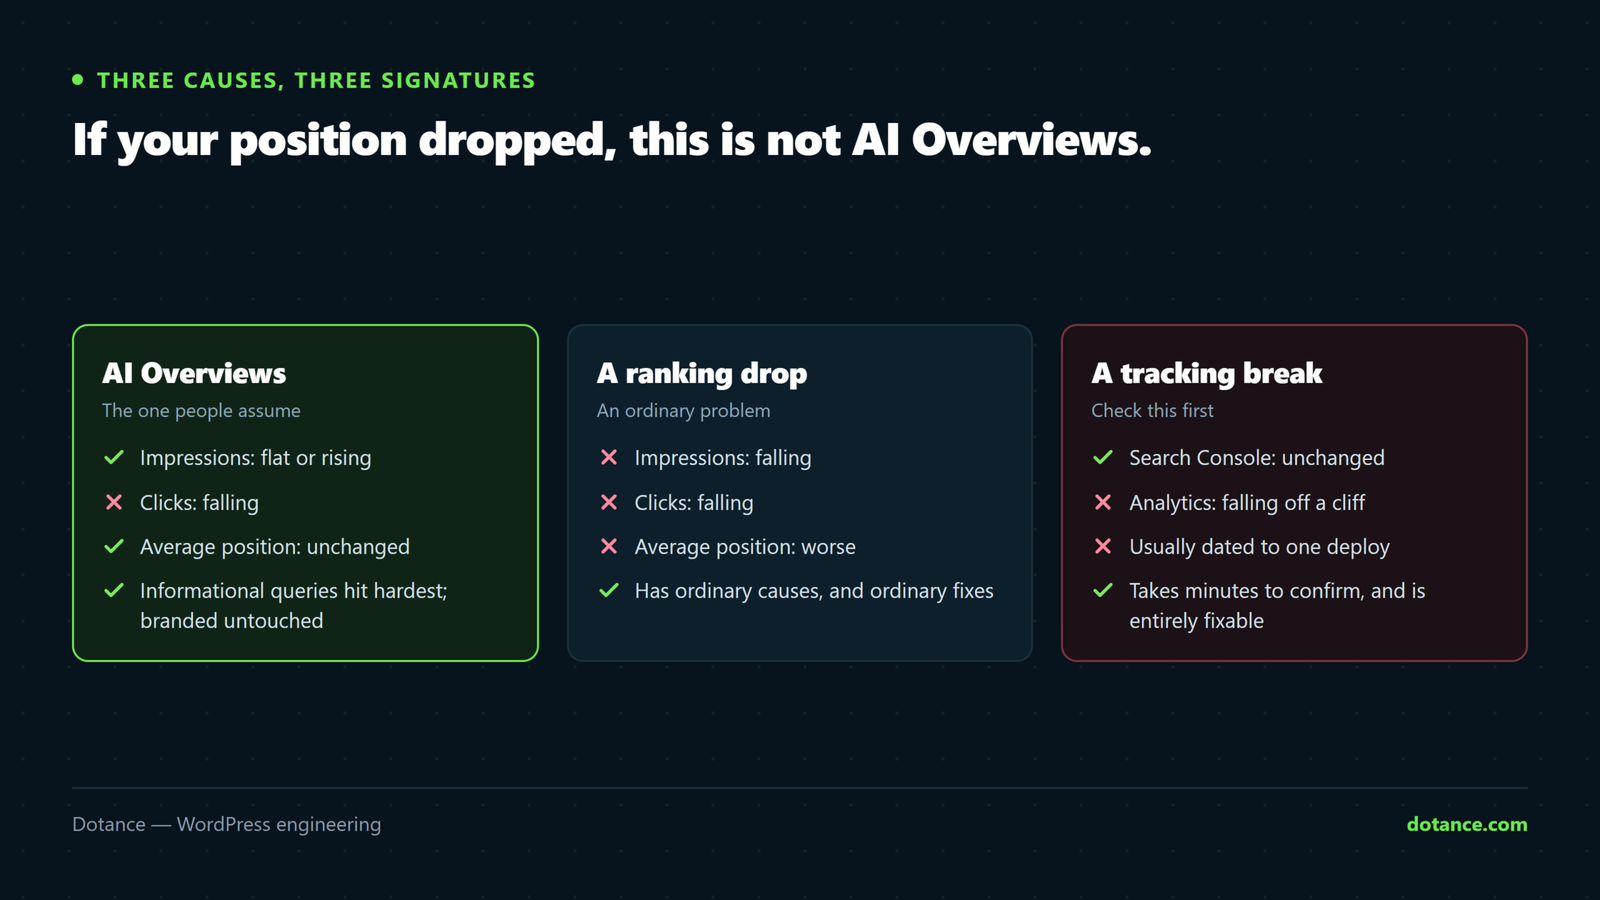
AI Overviews traffic loss moves three numbers together in a specific pattern. If yours do not match it, look elsewhere.
| Metric | AI Overviews | Ranking drop | Tracking break |
|---|---|---|---|
| Impressions | Flat or up | Down | Flat |
| Average position | Unchanged | Worse | Unchanged |
| Clicks | Down | Down | Down in analytics only |
| Click-through rate | Down | Roughly unchanged | Unchanged in Search Console |
| Search Console vs analytics | Both agree | Both agree | They disagree |
That middle column is the one people skip. If your average position went from 4 to 9, you have a ranking problem and AI Overviews traffic loss is not your diagnosis — the causes there are the ordinary ones covered in our technical SEO checklist.
The last row is the cheapest check of all. If Search Console shows your clicks holding steady while analytics shows them collapsing, nothing happened in search at all — your measurement broke, and that is a much better problem to have.
Why raw traffic charts mislead here: a traffic line going down tells you nothing about cause. Seasonality, a core update, a lost link, a redirect mistake and AI Overviews all produce the same shape. Only the combination of impressions, position and CTR separates them.
Five ways to measure AI Overviews traffic loss
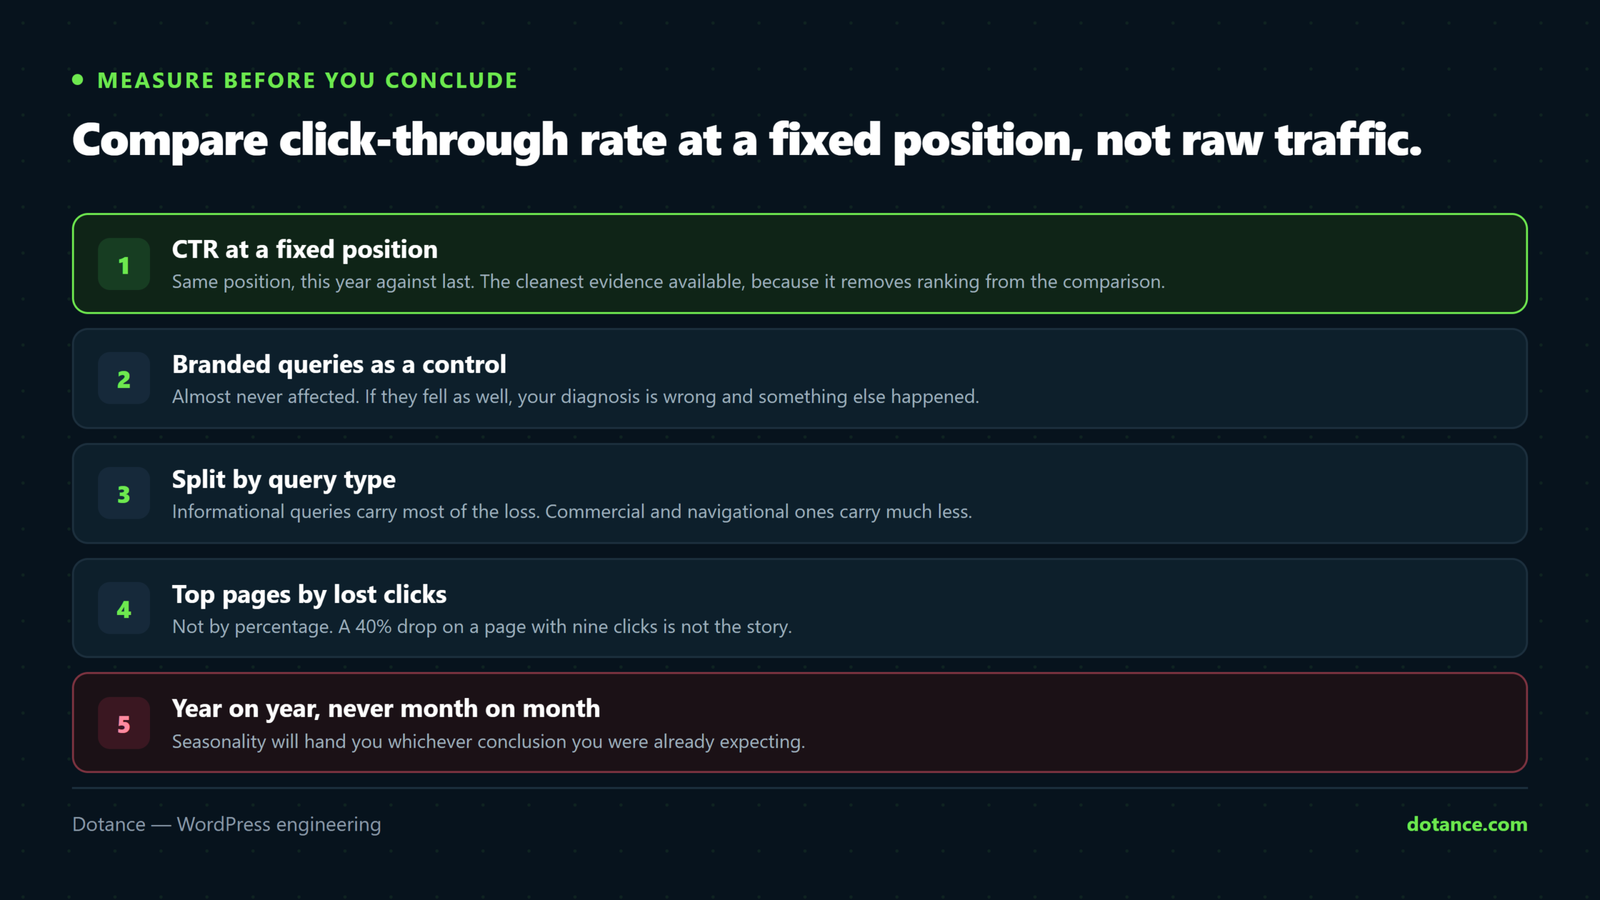
| # | Method | What it tells you |
|---|---|---|
| 1 | CTR at a fixed position | The cleanest evidence available |
| 2 | Branded queries as a control | Whether the decline is search-wide or specific |
| 3 | Split by query intent | Which kinds of question stopped clicking |
| 4 | Page-level before and after | Which pages actually carry the loss |
| 5 | Year-on-year, not month-on-month | Removes seasonality from the picture |
1. Click-through rate at a fixed position
This is the measurement that settles whether you have AI Overviews traffic loss at all. In Search Console’s performance report, filter to queries where your average position sits in a narrow band — say 1 to 3 — and compare CTR across two equivalent periods.
| Position band | Last year CTR | This year CTR | Reading |
|---|---|---|---|
| 1–3 | 28% | 19% | Strong evidence |
| 4–10 | 6% | 5.5% | Mild |
| Branded | 41% | 40% | Control — unaffected, as expected |
Ranking in the same place and being clicked less is the definition of AI Overviews traffic loss. It means the result is still there and fewer people need to open it, which is a different problem from being outranked and needs a different response.
2. Branded queries as a control
Branded searches are your defence against misdiagnosing AI Overviews traffic loss. Searches for your company name are almost never answered by an overview in a way that removes the click — somebody looking for you wants your site.
So branded CTR is your control group. If it fell by the same proportion as everything else, you are not looking at AI Overviews traffic loss; you are looking at something affecting all your search traffic, and that list starts with tracking, indexing and manual actions. If branded held steady while informational queries fell, the diagnosis holds.
3. Split by intent
AI Overviews traffic loss is not evenly distributed. Filter your queries into rough buckets and compare them separately. The pattern is consistent enough to be diagnostic on its own:
| Query type | Example | Typical exposure |
|---|---|---|
| Definitional | “what is a staging site” | High — fully answerable |
| Simple how-to | “how to clear wordpress cache” | High |
| Comparison | “wpml vs polylang” | Moderate |
| Commercial | “wordpress maintenance agency” | Low |
| Branded | your company name | Very low |
| Transactional | “hire wordpress developer” | Very low |
If your losses cluster in the top two rows and your commercial queries are untouched, you have a clear picture: you lost the traffic that was least likely to become a customer. That is not nothing, but it is a very different business problem from losing enquiries.
4 and 5. Pages, and the right comparison period
Sort your pages by lost clicks to see where AI Overviews traffic loss actually landed, then look at the top ten. Most of the time three or four pages carry almost all of it, and they will be your most purely informational guides.
Compare year on year rather than against last month. Search traffic is seasonal for nearly every business, and a month-on-month comparison in a quiet period manufactures an AI Overviews traffic loss story out of an ordinary August.
What is not AI Overviews traffic loss
Before accepting AI Overviews traffic loss as the diagnosis, rule these out. Each takes a few minutes and each is more fixable.
- A tracking break. Search Console and analytics disagreeing is the giveaway.
- A ranking drop. Check average position first, always.
- An indexing problem. If impressions fell too, pages may have dropped out — see a site not showing on Google.
- Seasonality. Compare the same months last year.
- A site change you forgot. A redirect, a noindex, a template edit, a migration.
- A core update. Check the dates against announced updates before blaming anything else.
The fifth row is the one that embarrasses people. A great deal of what gets reported as AI Overviews traffic loss turns out to be a change somebody made and did not connect to the decline — a category page set to noindex during a tidy-up, a plugin update that changed canonical tags, a staging site that went live with search engines discouraged.
What to do about the part that is real
Assume you have measured the AI Overviews traffic loss and it is genuine. The honest position is that some of that traffic is not coming back, and strategies that pretend otherwise waste a quarter.
| Page type | Outlook | Response |
|---|---|---|
| Definition pages | Poor — fully answerable without a click | Merge into deeper guides, stop maintaining separately |
| Thin how-tos | Poor | Same — consolidate |
| Guides with real data or numbers | Good | Add more of what cannot be summarised |
| Anything requiring your tool or service | Good | Make the dependency explicit early |
| Opinionated comparisons | Moderate | Take a position; summaries flatten hedging |
| Commercial pages | Unaffected | Leave them alone |
The pattern is straightforward once you see it. Content that can be fully summarised gets summarised; content that gives someone a reason to arrive still earns the click. A page whose value is a number you calculated, a comparison you actually ran, or a tool the reader uses cannot be replaced by three sentences.
There is a second, quieter upside. Being the source an overview draws on is itself worth something — it puts your name in front of someone at the moment they are deciding, even without a click. How to earn that is in getting cited by AI search, and the identity signals that help are in schema for AI search.
Do not delete the affected pages. A guide with falling clicks may still be the reason an assistant knows what you do, and it may still convert the visitors it does get. Falling traffic is a reason to reconsider what a page is for, not a reason to remove it.
A worked example
Numbers make an AI Overviews traffic loss diagnosis concrete. This is the shape of a diagnosis we ran on a services site whose owner had been told to expect the worst.
| Segment | Impressions | Clicks | Position | CTR |
|---|---|---|---|---|
| All queries, last year | 412,000 | 18,900 | 11.2 | 4.6% |
| All queries, this year | 438,000 | 14,100 | 11.0 | 3.2% |
| Branded, last year | 9,400 | 3,850 | 1.4 | 41.0% |
| Branded, this year | 10,100 | 4,090 | 1.3 | 40.5% |
| Commercial, this year | 22,000 | 1,780 | 6.8 | 8.1% |
| Commercial, last year | 21,000 | 1,690 | 7.0 | 8.0% |
Read it in order. Impressions rose. Position improved slightly. Clicks fell by a quarter. Branded held. Commercial held. That is textbook AI Overviews traffic loss, confined entirely to informational queries, with the part of the site that generates revenue completely untouched.
The enquiry count over the same period was flat. So the honest summary handed to the owner was: you have lost four thousand eight hundred visits that were never going to buy anything, your commercial visibility improved slightly, and your business has not changed. That is not a crisis, and it is not what a raw traffic chart appeared to say.
The action that followed was not a recovery project. Four thin definition pages were merged into two proper guides, and the effort that had been going into producing more of them went into a comparison piece with original testing behind it. Nobody tried to win back the summarised clicks, because nobody could have.
How to report it without causing a panic
Reporting AI Overviews traffic loss is a communication problem as much as an analytical one. A client who sees a falling line will fund the wrong thing unless the report frames it properly.
| Do not lead with | Lead with |
|---|---|
| A sessions graph | Enquiries over the same period |
| “Traffic is down 25%” | “We rank the same and fewer people need to click” |
| A recovery plan | Which portion is recoverable and which is not |
| Industry articles about AI | Their own branded control numbers |
The right-hand column is not spin — it is the more accurate description. AI Overviews traffic loss measured as a percentage of sessions overstates the commercial impact every time, because the traffic most exposed to it is the traffic furthest from a purchase.
Say what you do not know, too. You cannot see which specific queries triggered an overview, so any number you give is an inference from CTR patterns. Clients handle that fine when you tell them; they handle it badly when they find out later from somebody else.
Where this goes wrong
| The mistake | What happens | Do this instead |
|---|---|---|
| Blaming AI Overviews without checking position | You miss a real ranking problem | Position first, always |
| Comparing month on month | Seasonality read as a crisis | Year on year |
| Ignoring branded queries | No control group, no confidence | Use them as the baseline |
| Reporting raw traffic to a client | Panic, and the wrong response funded | Show CTR at fixed position |
| Deleting affected pages | Lose citations and residual conversions | Repurpose them |
| Writing more of the same content | More pages losing the same way | Write what cannot be summarised |
| Buying a recovery package | Money spent on an unfixable portion | Separate what is real from what is not |
The last row needs saying plainly, because AI Overviews traffic loss has become a selling point. Nobody can restore clicks that stopped happening because the answer now appears above the results. What a competent person can do is tell you how much of your decline is that, how much is fixable, and what the fixable part costs — and the first two of those are free to establish with the methods above.
A quarterly AI Overviews traffic loss routine
| Check | Where | Time |
|---|---|---|
| CTR at positions 1–3, year on year | Search Console | 5 minutes |
| Branded CTR as a control | Search Console | 2 minutes |
| Top ten pages by lost clicks | Search Console | 5 minutes |
| Commercial query performance | Search Console | 3 minutes |
| Enquiries, not sessions | Your own records | 5 minutes |
| Assistant referral sessions | GA4 | 2 minutes |
Twenty-two minutes a quarter, and the fifth row is the one that matters most. A site can lose twenty per cent of its sessions to AI Overviews traffic loss and hold its enquiry count exactly, because the traffic it lost was never going to enquire. If that is your situation, the correct response is to stop worrying about the sessions figure and say so in the report.
The last row pairs with it — assistant referrals are small but convert well, and tracking them properly is described in tracking AI search traffic in GA4. Together they tell you whether the shape of your acquisition changed or only the size of a number.
Search Console’s own performance report is the only first-party source for any of this; if you have never set it up, start at Google Search Console, because no third-party tool has access to your real impression and click data.
What to do with the pages you keep
Merging thin pages is the obvious half of an AI Overviews traffic loss response. The less obvious half is what you add to the ones that survive, because a guide that ranks and no longer gets clicked needs a reason to be opened rather than summarised.
| Add | Why a summary cannot replace it |
|---|---|
| A number you measured yourself | It exists nowhere else to be summarised from |
| A command or file the reader will copy | They need the page open to use it |
| A decision table with your recommendation | Judgement, not fact — and it is yours |
| A worked example with real figures | Specific enough that it has to be attributed |
| What you would not do, and why | Nobody summarises a caveat well |
None of that is a trick to defeat a summary. It is the same advice that was true before any of this: a page worth reading is one that contains something the reader cannot get by reading four similar pages. AI Overviews traffic loss has simply made the cost of not doing that visible in a chart, which is arguably a useful development.
The short verdict
Measure before you conclude that AI Overviews traffic loss is what happened. Position, impressions and CTR together identify AI Overviews traffic loss in about twenty minutes, and roughly half the declines that get attributed to it turn out to be a ranking slip, a tracking break or an ordinary seasonal dip — all of which are more fixable and none of which respond to the same treatment.
Where it is real, accept the part that is permanent and change what those pages are for. Merge the thin ones, deepen the ones carrying original work, and stop measuring the health of the site by a sessions figure that no longer means what it used to.
And keep the enquiry count in front of you throughout. It is the number the business actually runs on, and in most of the cases we have looked at it did not move at all.
Keeping the visitors who do click through: a chat that answers from your own pages, cites them, and asks for details when someone is ready to buy. That is what Askora does, and its unanswered-questions report is where the next page ideas come from.
Frequently asked questions
Can I see which queries triggered an AI Overview?
Not directly in Search Console — there is no filter that separates them. You infer it from the CTR pattern at stable positions, which is why the methods above are indirect. Anyone claiming exact per-query attribution is estimating.
How much AI Overviews traffic loss is normal?
AI Overviews traffic loss varies enormously by topic. Sites built on definitional and simple how-to content see the most; commercial, local and branded traffic sees very little. A site whose traffic is mostly transactional may see nothing at all.
Does blocking Google’s AI crawler help?
No, and it can hurt. Overviews draw on the regular search index, so blocking the separate AI crawler does not remove you from them — it only removes you from the assistant surfaces where you could have been cited. You lose the upside and keep the downside.
Will the traffic come back?
The portion lost to fully-answered queries, probably not. Planning on that basis is more useful than waiting. The portion that was a ranking problem or a tracking break absolutely can, which is why separating them matters.
Should I change my content strategy entirely?
No — adjust the balance. Fewer pages that answer a question completely and cheaply, more that carry something an overview cannot reproduce. The strategic framing is in GEO versus SEO.
How do I explain this to a client?
With the CTR-at-fixed-position table and the enquiry count side by side. “We rank the same, fewer people click, and your enquiries are flat” is a complete and honest story, and it is far more reassuring than a traffic graph with no explanation.
Is this different from losing traffic to assistants?
Yes, and they are often conflated. AI Overviews sit inside Google’s results; assistants are separate products people use instead of searching. Different surfaces, different measurement, and only the second one sends you referral sessions you can count.